Overview of used Tools, Services and Concepts
Navida Pro Data monitoring setup provides a comprehensive view of the data's quality, consistency, and security by utilizing a combination of open-source tools that specialize in metrics collection and visualization. Here's an overview of each component and how they contribute to the complete monitoring solution:
Flask application
Function:Flask application serves as a lightweight and flexible framework for web development in Python. It provides the necessary tools to build web applications efficiently and can be easily integrated with various services and databases. Click here to know more on Flask.
Role in Setup:Flask app collect data from PostgeSQL database by executing SQL queries and fetch metrics. It expose one or more HTTP endpoints that return the collected metrics. These endpoints would serve data in a format that can be consumed by Prometheus. This is used as a scheduler to run data collection jobs at regular intervals.The Flask app temporarily store data before it’s scraped by Prometheus, using in-memory data structures or a database.
Integration: The Flask app acts as a middleware between the PostgreSQL database and Prometheus, providing a custom solution tailored to specific monitoring needs
Prometheus
Function: Prometheus is an open-source monitoring system with a dimensional data model, flexible query language, and powerful alerting functionality.
Role in Setup: It collects and stores metrics as time series data from our flask application. Metrics can include various indicators such as response times, request rates, error rates, system resource usage, and custom business metrics.
Integration: Prometheus integrates with Flask application through client libraries that expose the necessary endpoints for Prometheus to scrape metrics.
Grafana
Function: Grafana is an open-source analytics and interactive visualization web application that provides charts, graphs, and alerts for the web when connected to supported data sources.
Role in Setup: It serves as the visualization layer for the metrics collected by Prometheus. Grafana allows you to create dashboards that provide real-time insights into application performance and system health.
Integration: Grafana is configured to use Prometheus as a data source, enabling you to query and visualize the metrics Prometheus collects.
Complete Data Monitoring Overview
- The Flask application queries the PostgreSQL database for metrics.
- The Flask application exposes these metrics at a specific HTTP endpoint in a format that Prometheus can understand.
- Prometheus is configured to scrape the Flask endpoint periodically and stores the retrieved metrics.
- Grafana pulls the stored metrics from Prometheus and displays them in visual formats like graphs and tables
Metrics: Prometheus captures detailed metrics from flask applications, which are then visualized in Grafana for real-time monitoring and alerting.
Sample screens
Example metric format from spring boot : dev-ey.navida-cloud.plus.aok.de/events/actuator/prometheus
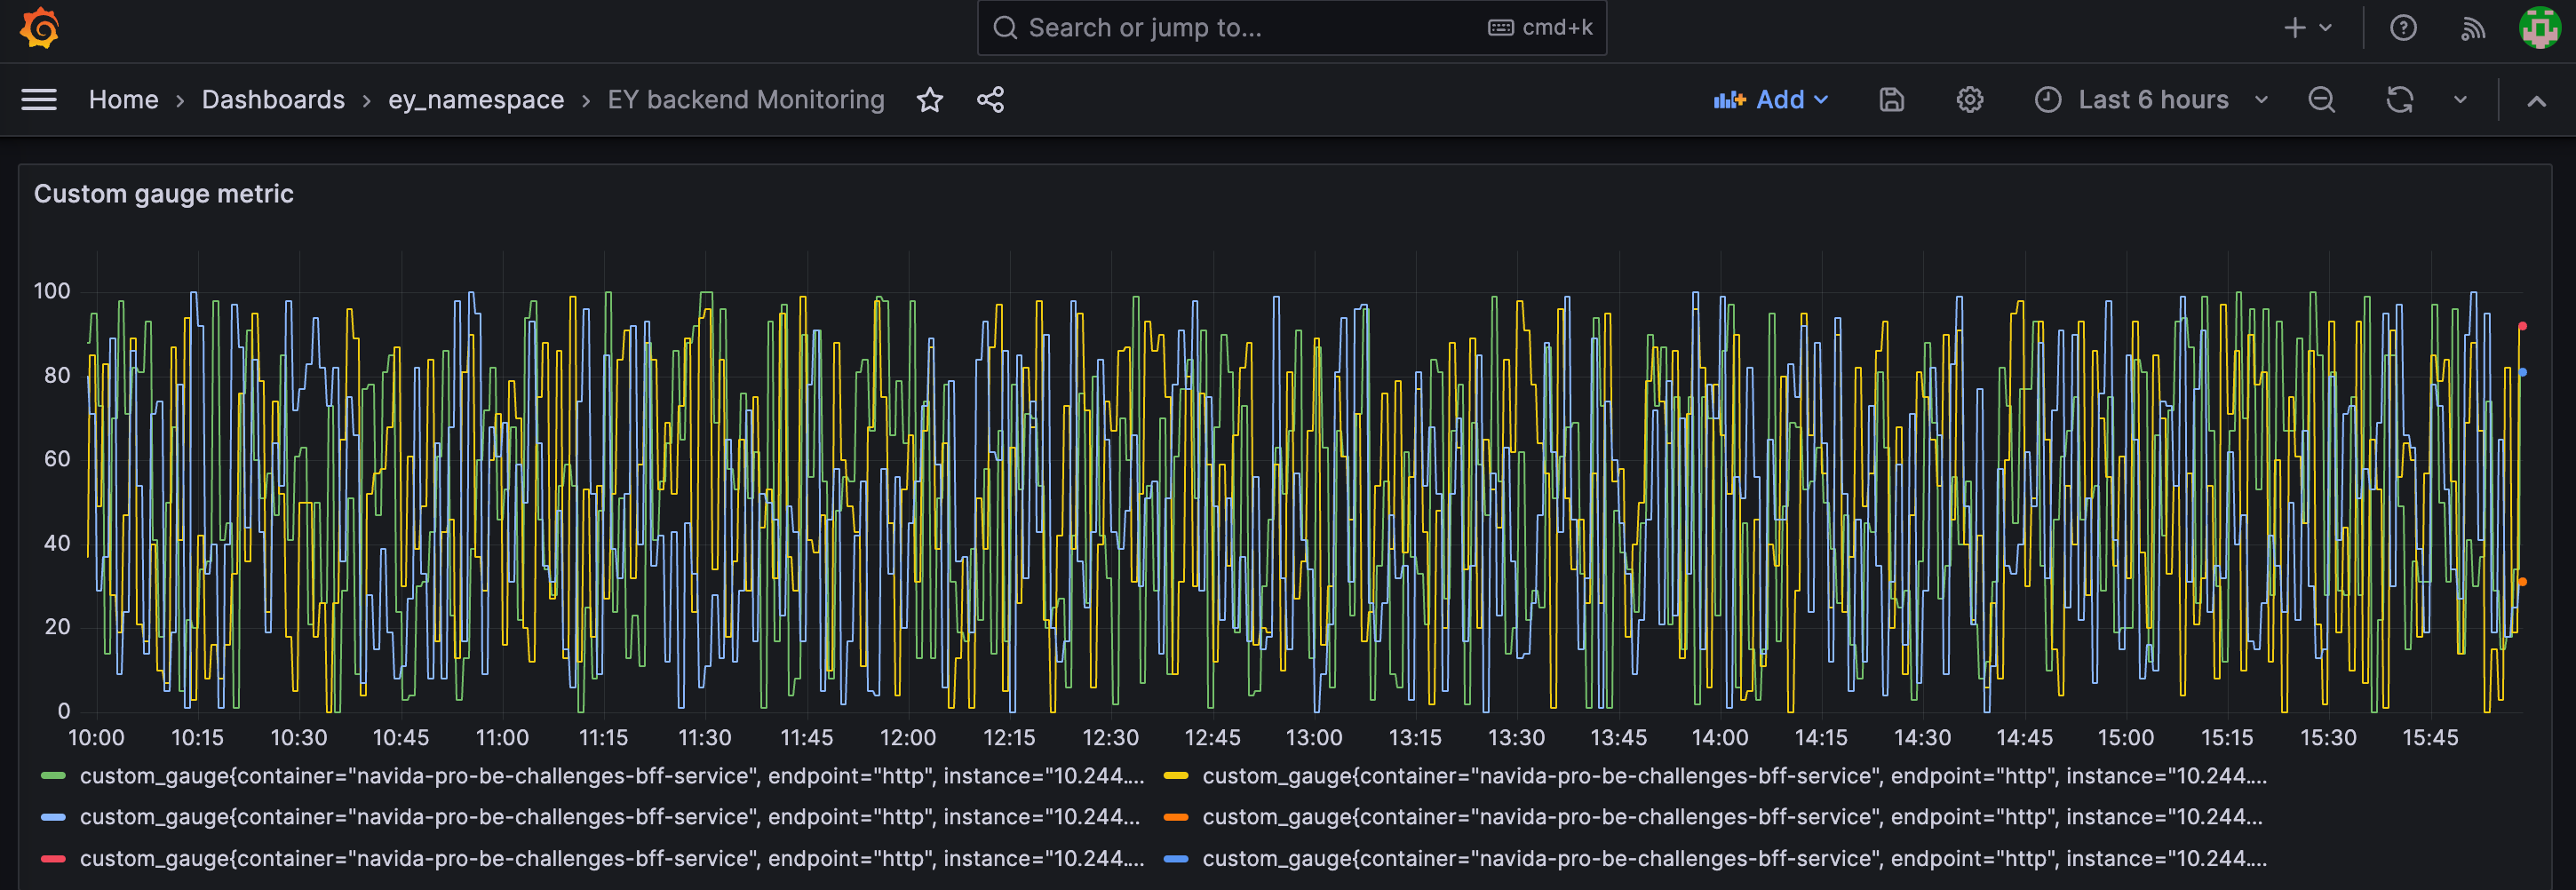
Grafana
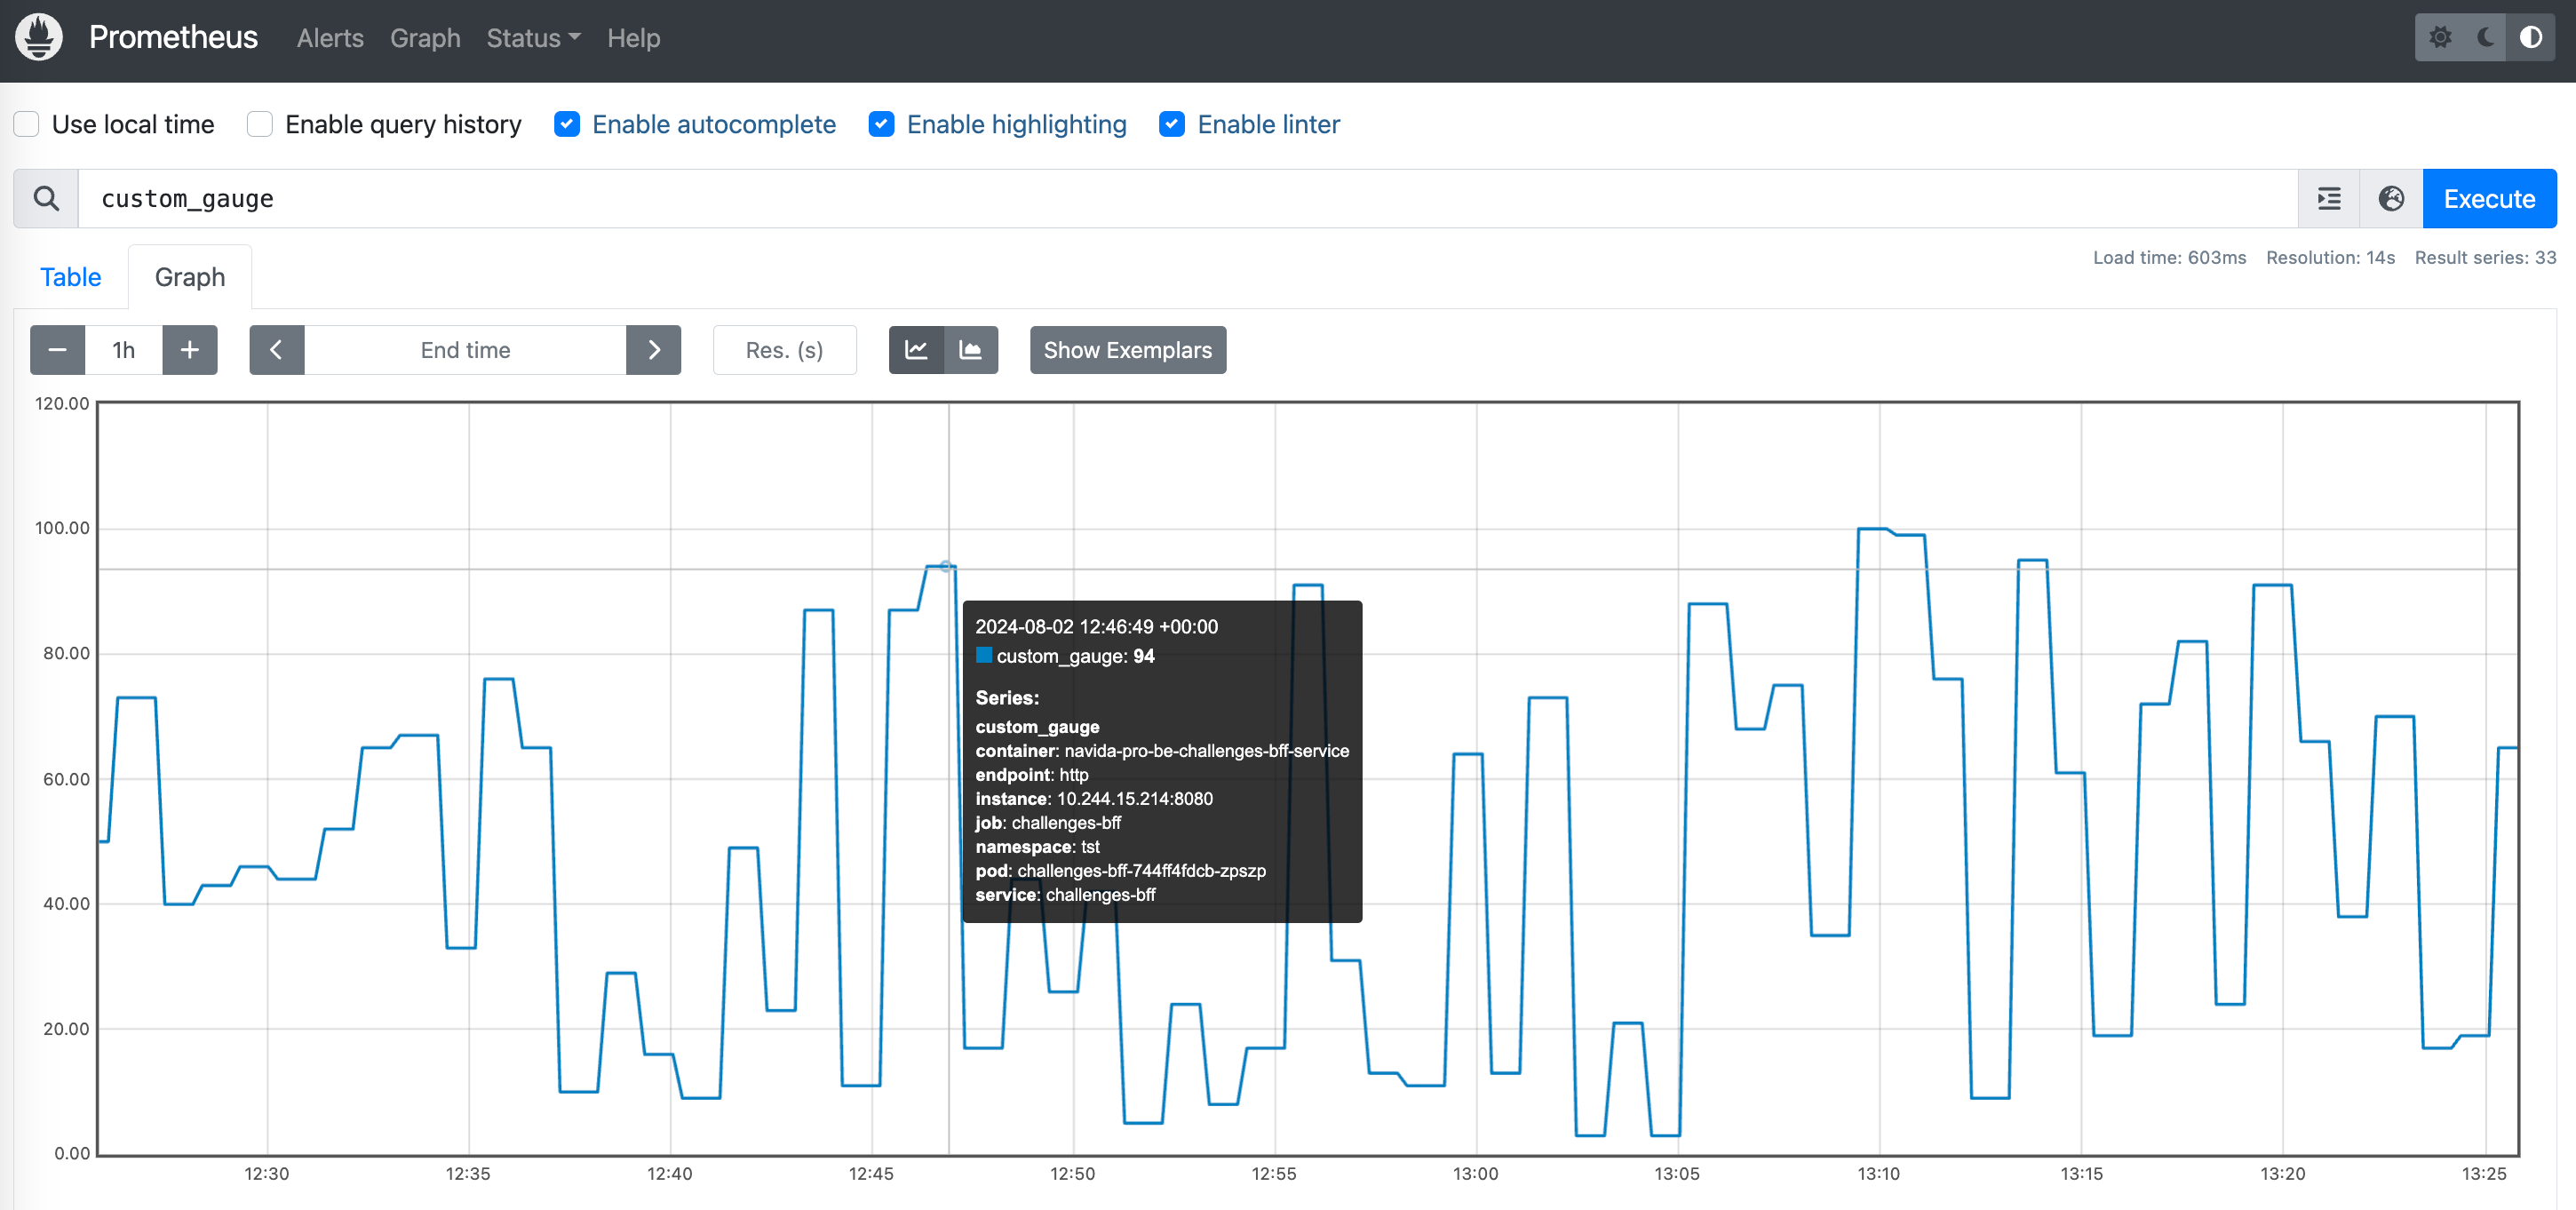
Prometheus
By leveraging these tools together, we can ensure that we have a detailed understanding of the system's health and can quickly respond to any anomalies that may arise, thereby maintaining a high level of service reliability and a positive user experience.